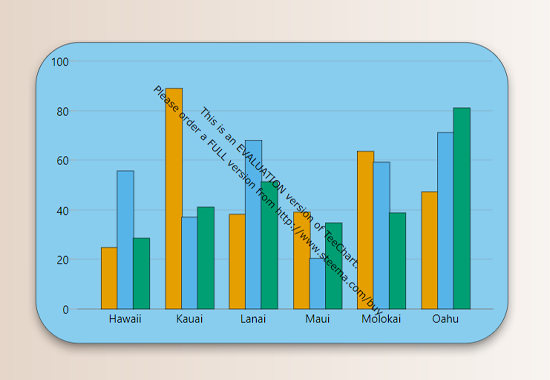
📊 Multiple Chart Types
Choose from bar, line, scatter, polar, 3D, statistical, and financial charts. Experiment with over 60 styles and see instant results.
- 2D and 3D support
- Multiple series display
- Statistical overlays & calculations
- Real-time updates as you make changes
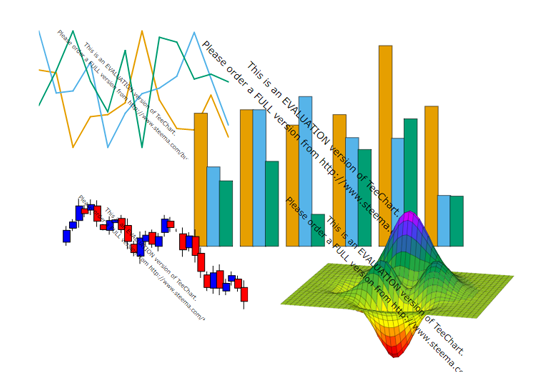
🎨 Customization & Modification
Effortlessly modify every aspect of your chart: colors, styles, fonts, axes, gridlines, backgrounds, borders, and legends.
- Axes: visibility, style, breaks, grid bands, logarithmic scaling
- Legends: show/hide, styles, position, palette-based, font customization
- Labels: visibility, font, color, placement
- Markers & lines: add/remove, style, draggable
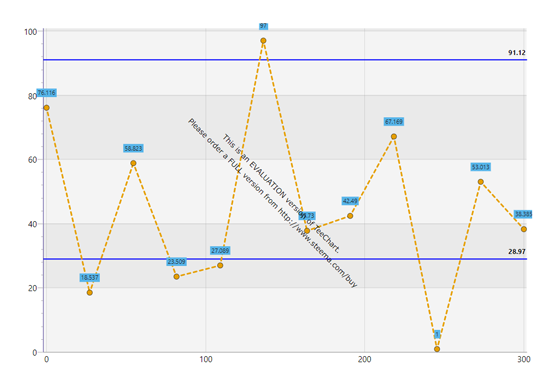
📈 Curve Fitting & Statistical Analysis
Apply linear, polynomial, exponential, and other fits. Instantly view regression coefficients, R², and error metrics.
- Prediction & confidence intervals
- Equation display, ANOVA & coefficient tables
- Statistical overlays: moving average, derivatives, histograms
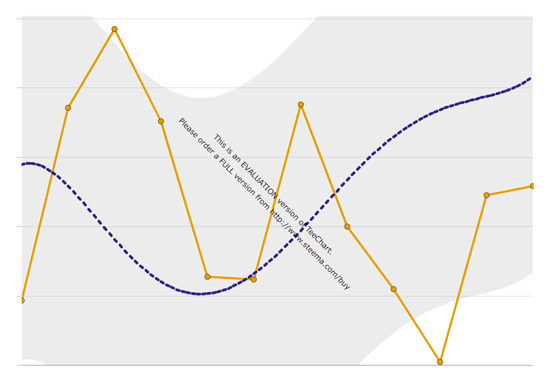
💾 Export & Library Management
Save charts as SVG, PNG, or templates. Organize and reuse images with a comprehensive image library.
- Export as vector or raster
- Full library management
- Professional appearance: background, border, shadow, opacity